Blog

Mote Housing Prototyping

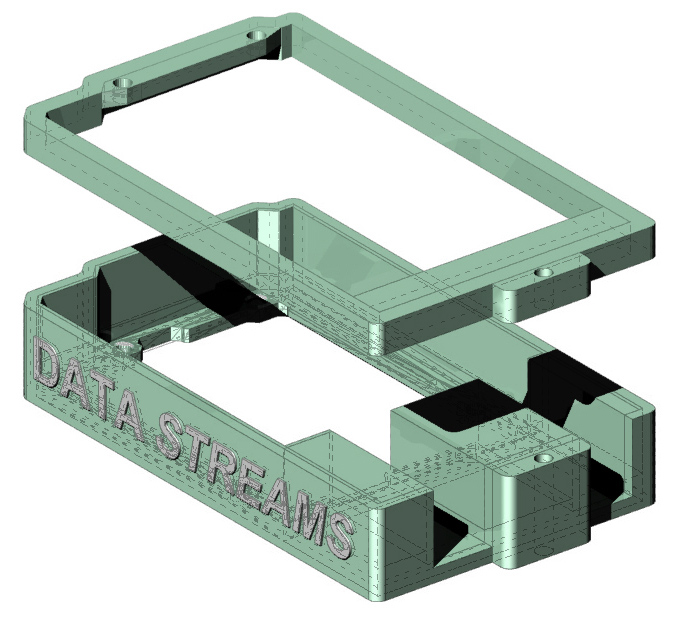
Initial prototyping for remote housings has begun. Since we don’t yet have access to a 3D Scanner, the initial prototype had to be measured by hand using a digital caliper and modeled in Rhino. After a few iterations  to get measurements and clearances right, we’ve got a working prototype that will fit our sensor setup.

Refining and further design still need to happen, but the economy case has been developed and will protect the electronics during the first few weeks of data output. Constraints with our design include: open air access to all sensors and board, airflow to the Arduino to keep the sensor from overheating, and limits due to 3D Printing (our available prototyping tool of choice).

Thoughts, branding ideas, form suggestions welcome!

Render ModeMote

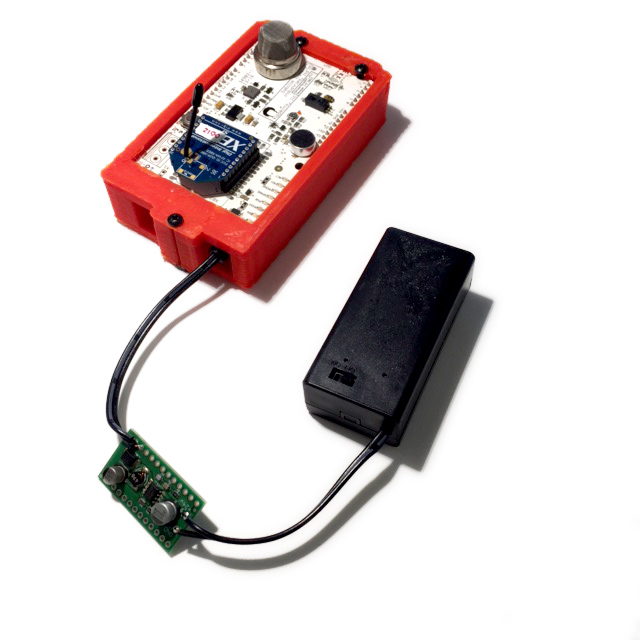
reMOTE Configuration

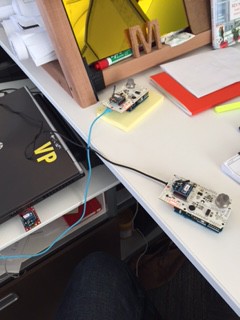
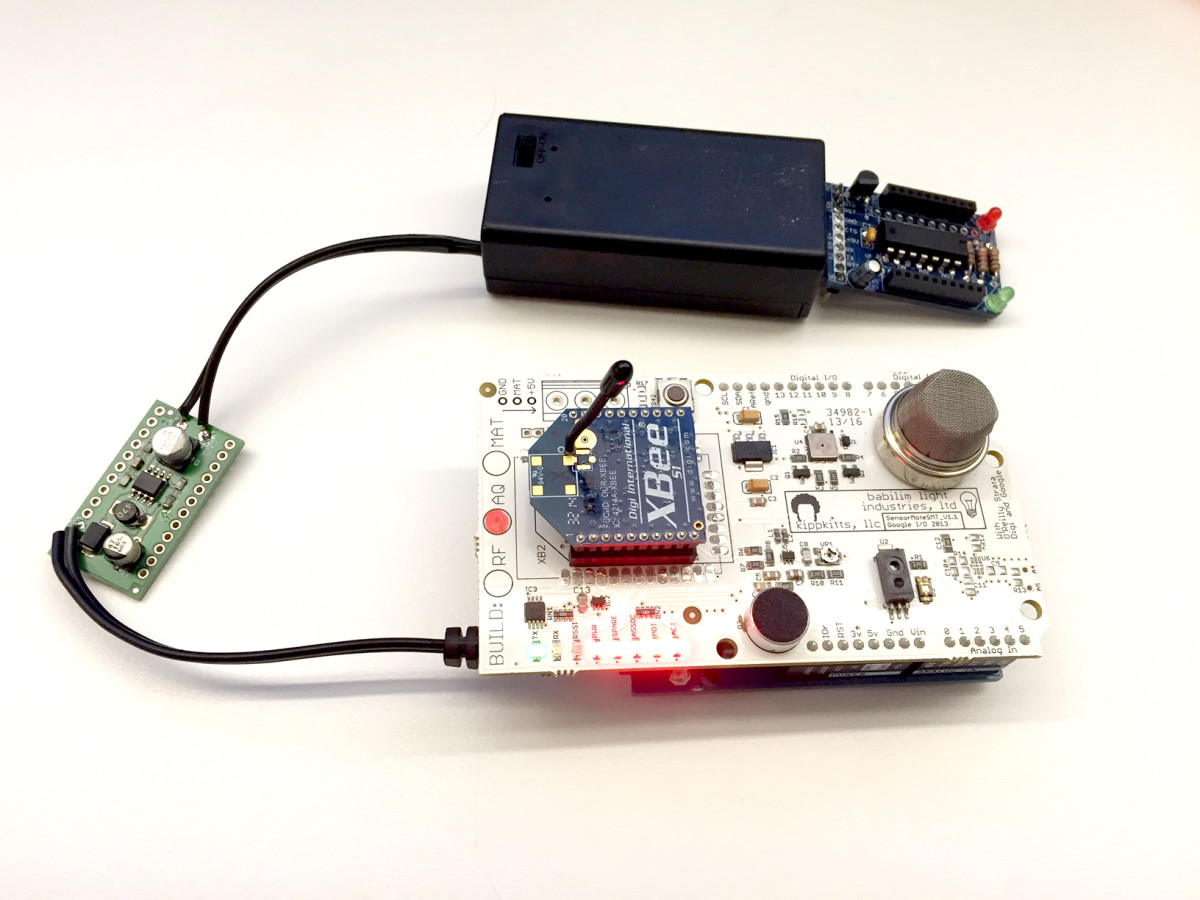
The environmental sensors are configured and are ready to be deployed wirelessly. We will be setting up the initial two sensors on opposite ends of the office to track both light and temperature swings, but also evaluate noise and traffic levels in “client” vs “office” spaces. Over the next 3-4 months we will continue gathering data from these two sensors, as well as adding additional sensors in the coming months.

IMG_2940 IMG_2941

Energy Values

Wouldn’t it be nice to know your individual contribution to the energy “pull” from the meter?  No, you don’t want to think about it?  Well then you aren’t like us.  Instead of pulling numbers from an outdated table or schedule of values, we will be able to one day know what each individual’s “E-Value” is.  Don’t believe me?

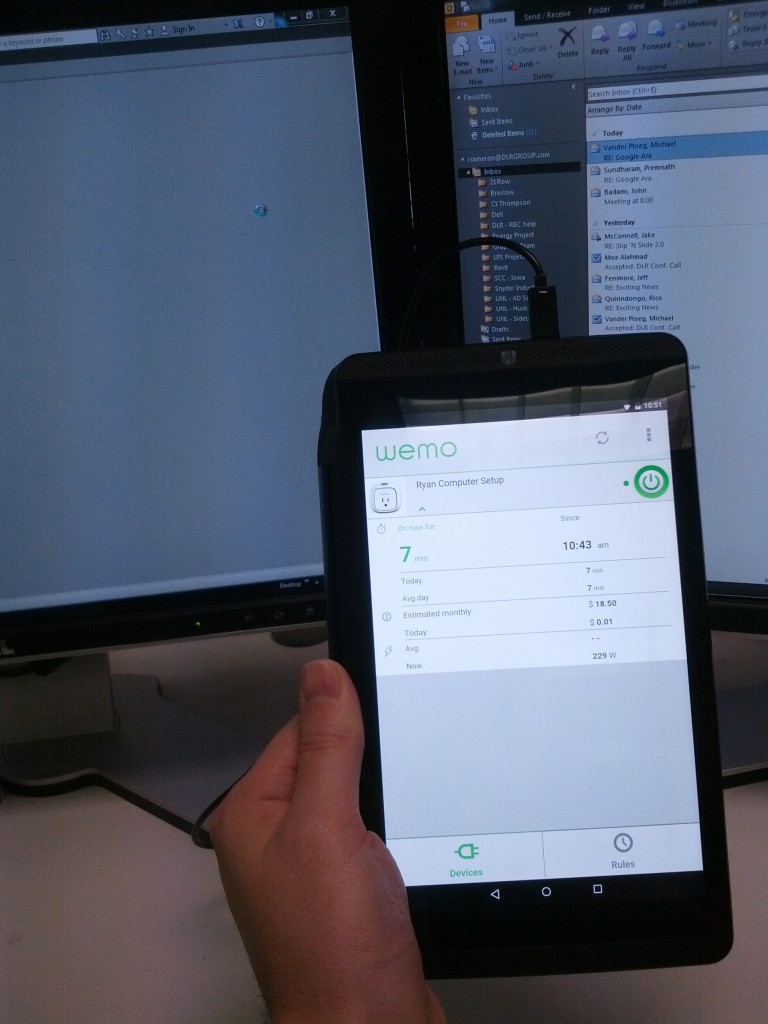
Seeing is believing!  We are collecting energy data live in the Lincoln Office!  Four workstations and a conference room are sending watt usage totals per an individual basis.  These report on a per second basis, but only initialize their values daily to a spreadsheet.  Not bad for our first month of PDG!

RBC - Energy WEMO

Don’t worry Dennis, I don’t actually cost the company $18.50/mo on electricity, it was still averaging down!

The Napkin (or small notepad) Sketch

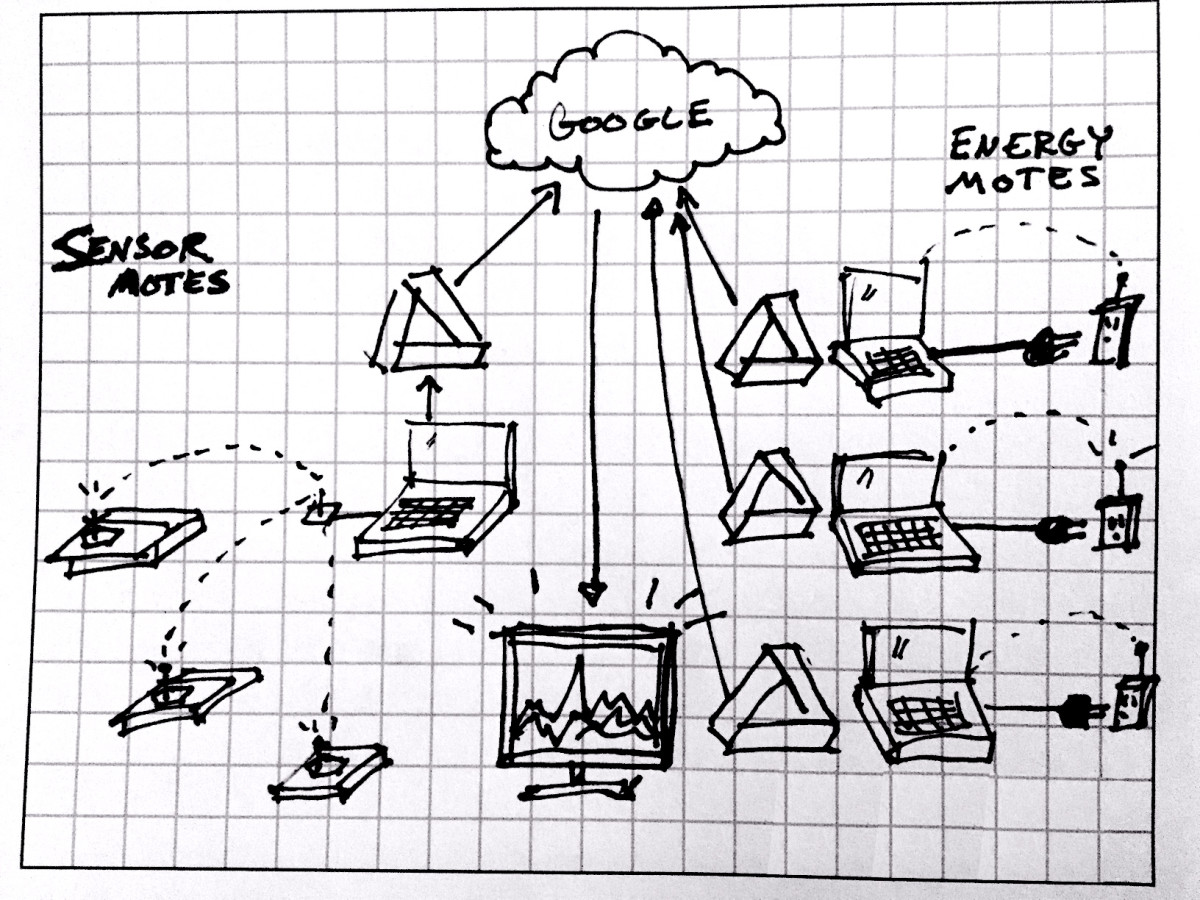
It’s seems like with many problems we face there are 1,000,000 solutions that could work. Some are better than others and some are more attainable than others. When Ryan and I first talked about ways to configure, collect, program and portray the data collected for Data Streams we had many ideas. Proprietary Software Packages, finagled open-sourced software codes, custom built processing packages coded by Seattle freelance code engineers – just to name a few. But the more I thought about it, the more I figured there HAD to be an easier solution. Something simple that is widely used, but maybe not always for this intended purpose. And it came one night while checking my email – gmail to be exact. I had a pop up from Google advertising Drive for you Desktop. A simple plugin that allows you to interact and manipulate files from the desktop of any computer and link them LIVE to a single Drive account in the Cloud. This allows us to feed sensor data from a desktop in Seattle, a workstation in Lincoln, or a conference room in Shangai all back to a DLR Group based Google Drive account linked to a data visualization software like Tableau or Domo with a few easy modifications!

So, that’s it! Simple as pie right? We hope so to…

Working Prototype!

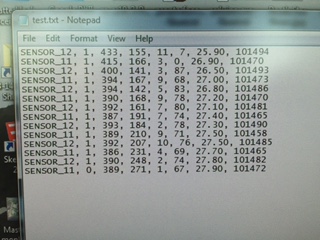
Our first environmental sensor prototype is working analog.

(the xBee radio relay hasn’t been fully configured yet, but we’re conducting data tests via serial connection)

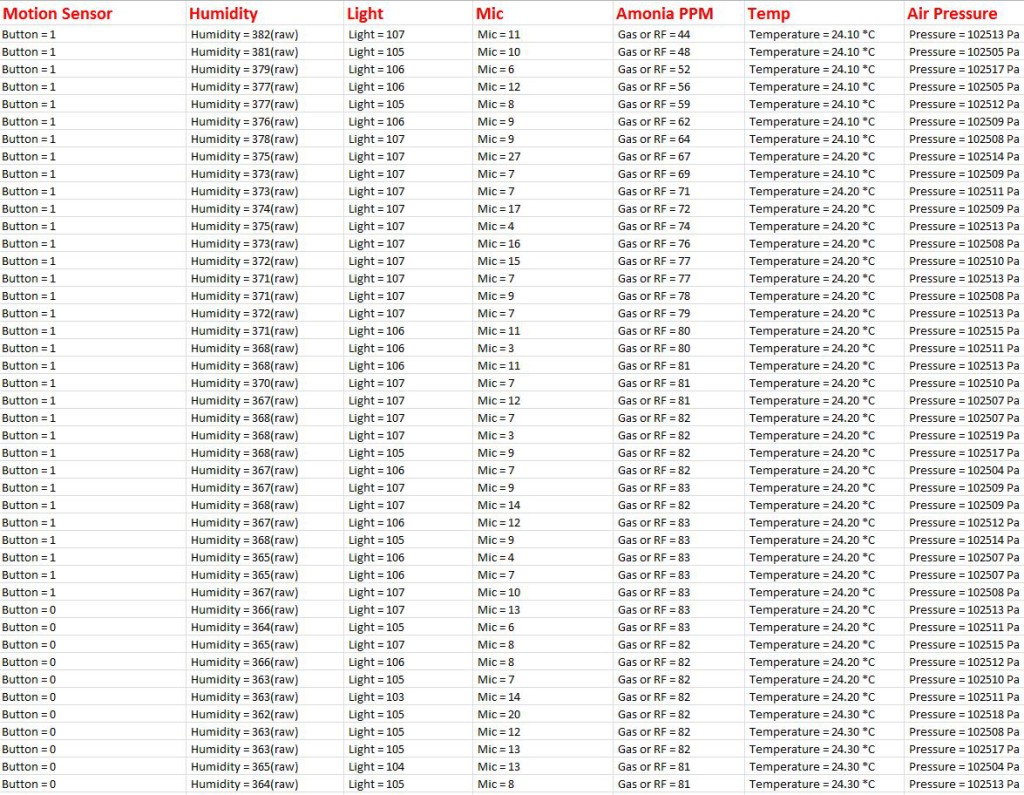
Numbers on a spreadsheet look ok… I’d rate them about a 4 on the sexy scale (more for the excitement of seeing your first data), but the final graphic display will be a drop-dead GORGEOUS 10 we promise!

As promised – more to come on coding, frizzing, and troubleshooting soon.

Data

Social Media

Stay up-to-date with our latest findings and progress