Building Data Dashboards
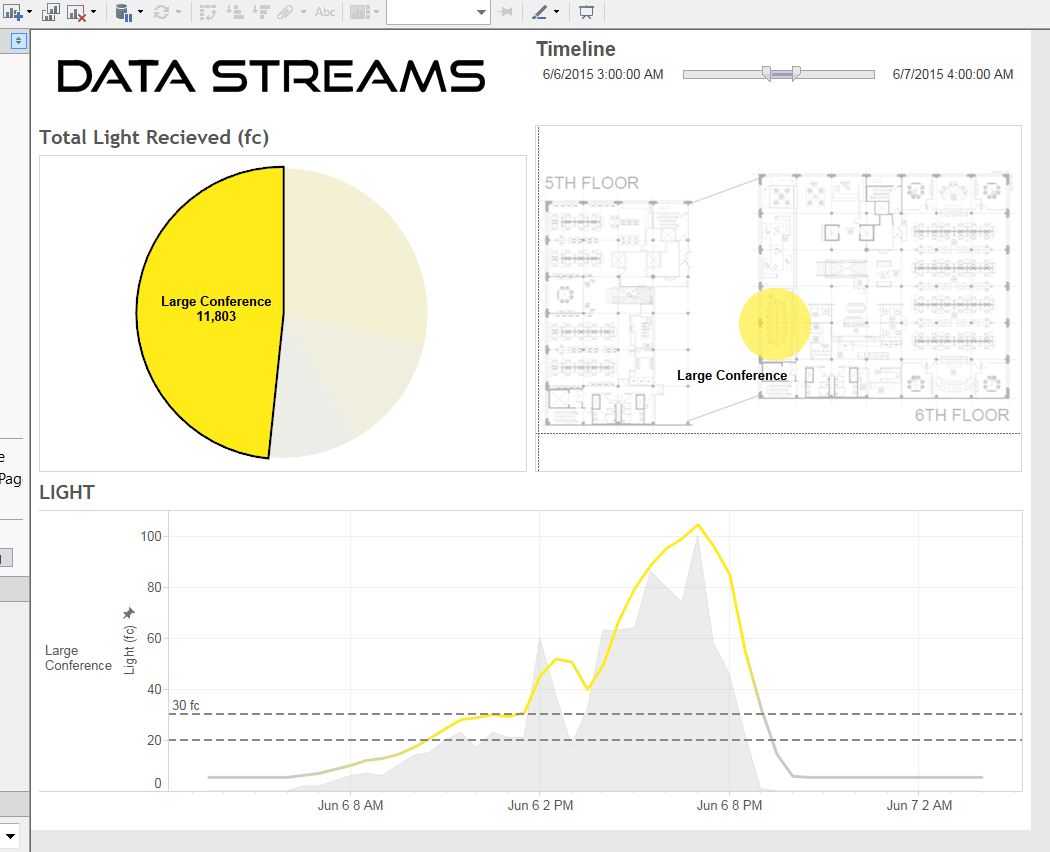
Using our data that’s stored in the cloud and linking it into Tableau, we’re able to create interactive dashboards for our sensors. As you can see we’re able to gauge things like total light received, relative light in relation to office areas, and light over the course of a day.
The rest of the dashboards should be completed this week and hopefully will be test embedded in the website next week.