Blog

Sources

Its probably about time I started revealing some of the sources we’ve been reading to help keep our thoughts sharp. While not as extensive of a list as I had hoped to get through, this provides quite a few notable resources of knowledge to pass ideas to and from.


Collective Intelligence in Design: Multiple Authors – AD

http://www.wiley.com/WileyCDA/WileyTitle/productCd-0470026529.html

For a book from 2006, this was far ahead of its time.  Visualization of data elements are at the core of this read.  Adaptively and creatively manipulating data and displaying it in very structured data sets helps enlighten the reader by showcasing 3D data sets and their purposes.


The Naked Future: Patrick Tucker

http://www.amazon.com/Naked-Future-Happens-World-Anticipates/dp/1591847702/ref=sr_1_1?s=books&ie=UTF8&qid=1432411034&sr=1-1&keywords=the+naked+future

This is the latest, newest, fastest book of the bunch.  An in depth look at how data is being used and could be used in the future to predict where you’ll be, who you’ll talk to and even what you buy long before you do.  Terrifying and Awesome at the same time!


The Data Revolution: Big Data, Open Data, Data Infrastructures and Their Consequences

http://www.amazon.com/gp/product/1446287483/ref=oh_aui_detailpage_o01_s00?ie=UTF8&psc=1

Right in the mix on this one.  If you like to crunch words together, then this is the book for you.  More of an instructional guide on how one can go about organizing data as well as explaining data in intelligent ways.  A very strong read indeed.


Good to Great: Jim Collins

http://www.amazon.com/Good-Great-Some-Companies-Others/dp/0066620996/ref=sr_1_1?s=books&ie=UTF8&qid=1432411213&sr=1-1&keywords=good+to+great

After a brief conversation with Charles at the 2014 Central Region year end, he convinced me to put this to the top of my reading list.  I’m glad I did, since it is important to always remember what you’re going after and why its important.  We can read all the books on tools, electronics, software and data we want to fill our heads with, but without scope and vision, all that knowledge never gets organized enough to reach its full potential.


Raspberry Pi Projects: Andy Robinson – Mike Cook

http://www.amazon.com/gp/product/1118555430/ref=oh_aui_detailpage_o05_s00?ie=UTF8&psc=1

What a great starter book to get going on your Raspberry Pi projects.  All this info is very similar to what you can do on all developer boards, like nVidia’s Jetson TK1 and Arduino Uno’s.  I’m so glad to have new challenges for ourselves as we begin to dive deeper into data collection and optimization.


Exploring Arduino: Tools and Techniques for Engineering Wizardry – Jeremy Blum

http://www.amazon.com/gp/product/1118549368/ref=oh_aui_detailpage_o04_s00?ie=UTF8&psc=1

Are you collecting data?  This might be the best way to start building sensors and implementing their processes.  While you can always buy pre-made versions of someone else’s design, this is for that custom home-brewer who prefers to customize their sensors to their taste.


Beginning Sensor Networks with Arduino and Raspberry Pi

http://www.amazon.com/gp/product/1430258241?psc=1&redirect=true&ref_=oh_aui_detailpage_o01_s00

Dreaming about building your own elaborate sensor network with low cost processor boards?  Then look no further.  This step by step guide is nearly an instruction manual on how to implement basic sensor network operations.  It also includes code snippets, directions, weblinks and other tips & tricks to help get you started.

Quality Data, Compatibility and Next Steps

Results, reports, graphs, presentations… call them “Deliverables” are only as good as the DATA you collect. Though accuracy is important, what we’re finding out with DataStreams is parameters and consistency are just as important. Questions: What happens when a sensor misreads? What happens if power goes out or the server gets reset? How does your data correct itself and mend while you’re away? These are the current issues that will need to be addressed with our prototype in the future.

So far we’ve created a working prototype system that can be used to monitor and analyse data in our environment – however it’s only a prototype. Engineers and programmers will need to streamline the process, add digital sorting parameters, and create redundancy in the data collection system. This is all part of Phase II of data streams if the prototype is received as viable.

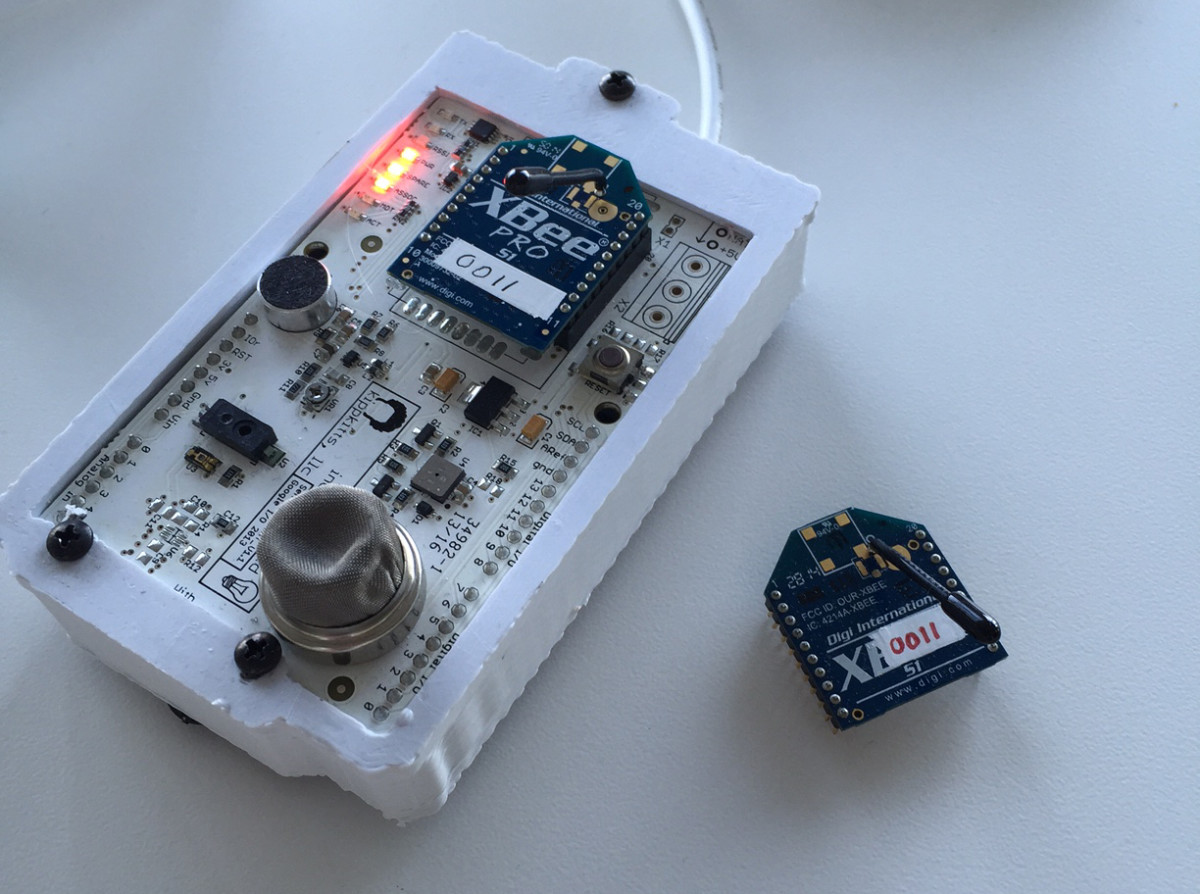
That being said, I’ve made some changes due to hardware compatibility issues that were discovered during our current BETA test series of the modules. xBee modules vary in power and range and though they are intermittently compatible, over a longer period, they begin to cause problems in data transmission. I’ve converted all our radio relays to xBee Series 1 Pro modules that have a theoretical range of around 1 mile. (this distance becomes substantially less once walls, floors and ceilings are in the mix) however, it is a great improvement from our original modules that had a range of 60 feet!

We’re also currently working with Tableau to form some custom coding that will allow us to link data sets from different sensors and share information like Time Stamps and Location to create more accurate reports. We’re having some difficulty getting the programming to where it needs to be, but we’re confident we can have a full working BETA come June.

Thanks to Ryan and all those who have been following and contributing to the conversation. It’s been really exciting to watch this develop.

Battery Future?


With the announcement of of Tesla Motor’s entry into the home charging appliances, I can’t help but think that some people might say that already puts Data Streams out of business.  Solar power is free, so why would I care where my energy goes?

To the contrary…. let me explain.

A) We are more than just an energy monitor and analysis platform.

B) You would still need to realize what in your house consumes energy from a management standpoint.

A rechargeable battery is just that, rechargeable.  It doesn’t matter if it powers your car, your house or your 1970’s era disco ball twirler.  It will run out and need replenishing.  So why not track what changes are happening to the apparent load on the circuit?  While we can’t all afford $5000 (solar panels + inverter NOT included BTW!) battery packs to take up to 25% of my electric bill down, we CAN track how much energy we use and create a plan that is right for you.

What is going on in your house is pretty simple and straight forward.  The refrigerator always needs to be on, your oven gets intermittent use but what about plug load and lighting?  Does your cell phone pull a lot of wattage when recharging?  probably not.  However, whether you’d like to admit it or not, you do leave things on.  Computers, laptops, LED lights (yes, those still pull wattage) and oops, you left your home stereo system on “pause” during Saturday Night Fever again.  Yes, while it isn’t pulling a full load that it would be if left playing, it is pulling more than standby mode.

So why are you constantly recharging your shiny new semi-explosive Tesla wall mounted battery?  Probably because you didn’t know you left your disco ball on!  Most likely the savings you could have from a rechargeable battery could be paid for by simply recording how you use energy in the first place and improving your schedule.  Not unlike what a coach does for their players.  “You did this, this and this well, but let’s work on improving your score <here>”.


Data Streams Unites!

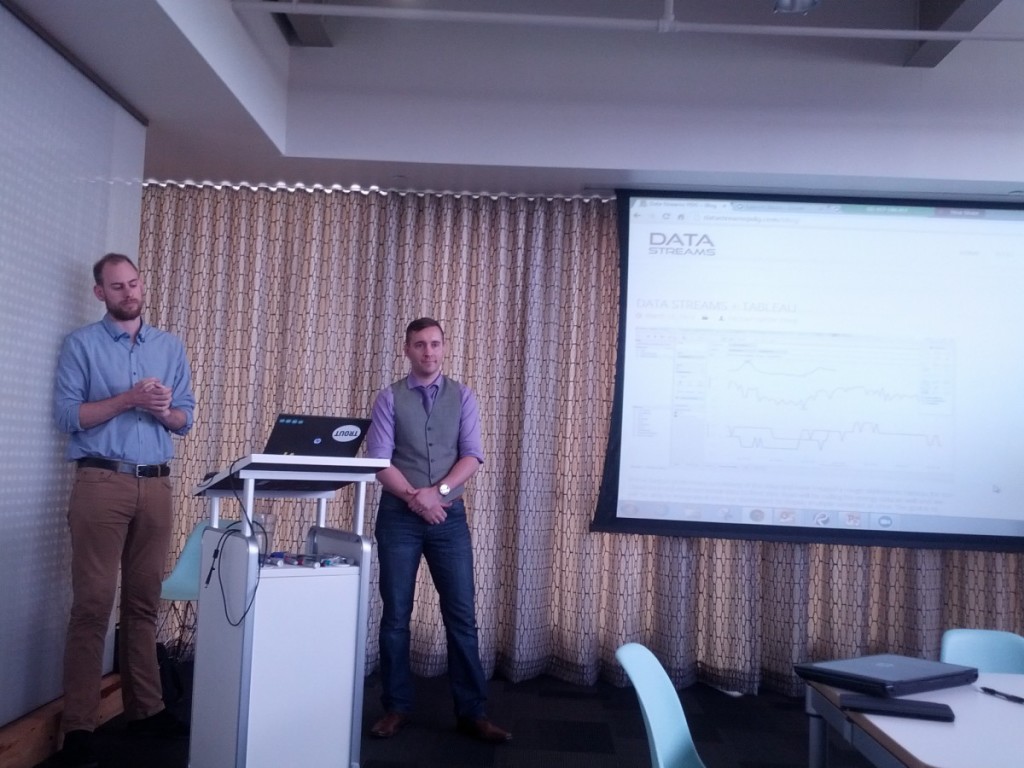
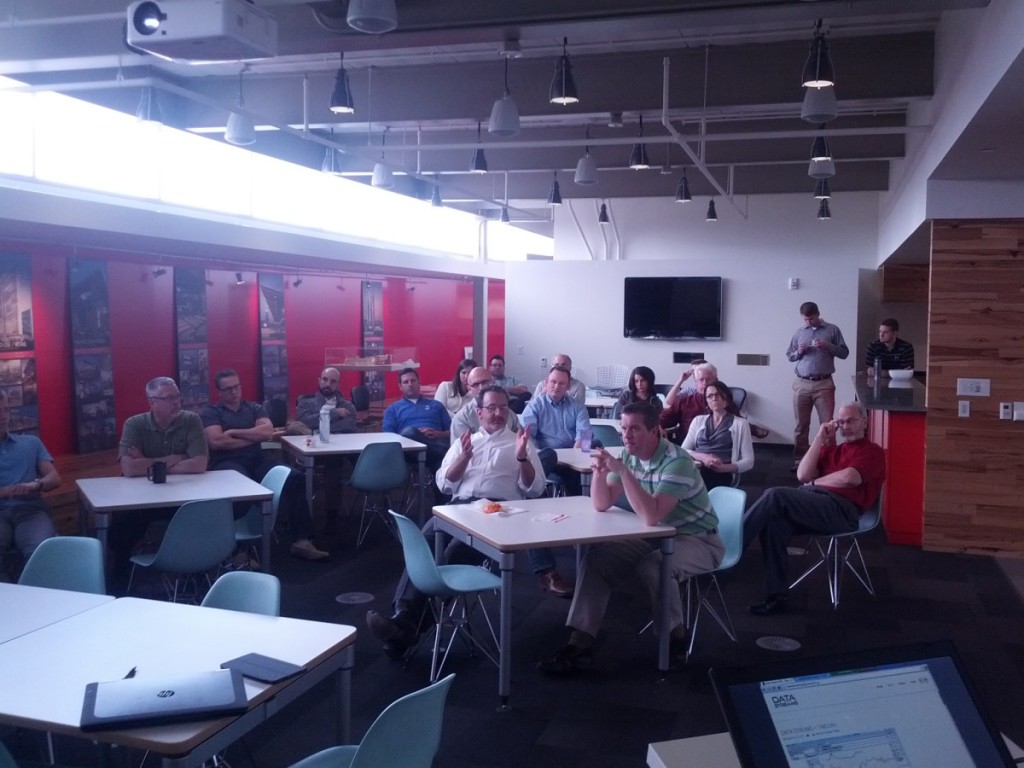
A lot of people might not realize Michael and I haven’t met yet.  Until today that is.  It was great to get a pair of brainstorming sessions in Omaha during MVP’s travels here.  Thank you Omaha Office for hosting us and allowing us to take over the conference room palace of 3rd floor and have it all to ourselves!

IMG_20150414_152606

For those of you lucky enough to attend, we appreciated your support and Mr. Gatewood’s questions!

“Its sort of like inventing the “FitBit” but for buildings.”

IMG_20150414_152631


Imagine this if you will:

—————————————————————————————————————————————————————-

Fitbit:  You road 12.3 miles today

Me: I know how far I went, I mapped it out in my head…its close enough

Fitbit: You burned 488 calories

Me: Not pertinent, I know I’m fat and need to work out

Fitbit: Did you know if you took this alternative path for 2.3 miles south and 1.8 miles north you would have changed elevation 6 times and cut 1.8 miles out of your journey, resulting in 56 more calories burned?

Me: Oh, well that is good to know because that will get me in shape faster and I won’t have to take as much time out of my day to exercise. Thanks Fitbit.

Fitbit: No problem Fat Boy.

—————————————————————————————————————————————————————

Data Streams:  Your infrastructure consumed 5.985 kWh today

Me: Ok, there’s nothing I can do about that, so thanks for nothing.

Data Streams: 7 classrooms had lights turned on all day but my sensors indicated that the room was never occupied (verified by motion and CO2 levels).  This would have resulted in a net energy savings of 0.715 kWh

Me: Well a lot of good that does me now!

Data Streams: Thanks to my backlog of data, tomorrow I predict the same result.  Now would be the time to shut them off.  I am also predicting that Classroom 128 will be under-utilized.

Me: Oh….yeah.  Thanks.

Data Streams: This will result in a net cost savings of $35/month for the year if this result were to continue.

Me: Nice!  What other problems do I have?

Data Streams:  Let me check.  Oh boy, you have other issues.  68 Results.

Me:     <Charlie Brown face>   :S

Data Streams:  According to my records, Office 233 is only occupied 16 days out of the calendar year.  Could this room be better utilized?

Me: Yes, that room is no longer an office.  Glad you caught that. Let me issue an “AR” (allocation request) to the FM/Owner to see if we can better use that square footage.

Data Streams: My results show that sunrise is now at 6:25am due to daylight savings time.  Your exterior lights are still pulling load from 6:25am to 8:00am.  Turning those off, or dimming the settings could result in using 0.233kWh to 0.295 kWh less than leaving them on.  This will result in a cost savings of $15/month for the year if this result were to continue.

Me: Nice! Hmm…We still need lighting until at least 7AM because it is not light enough out to justify turning those lights off completely. I will adjust that setting accordingly.

———————————————————————————————————————————————-


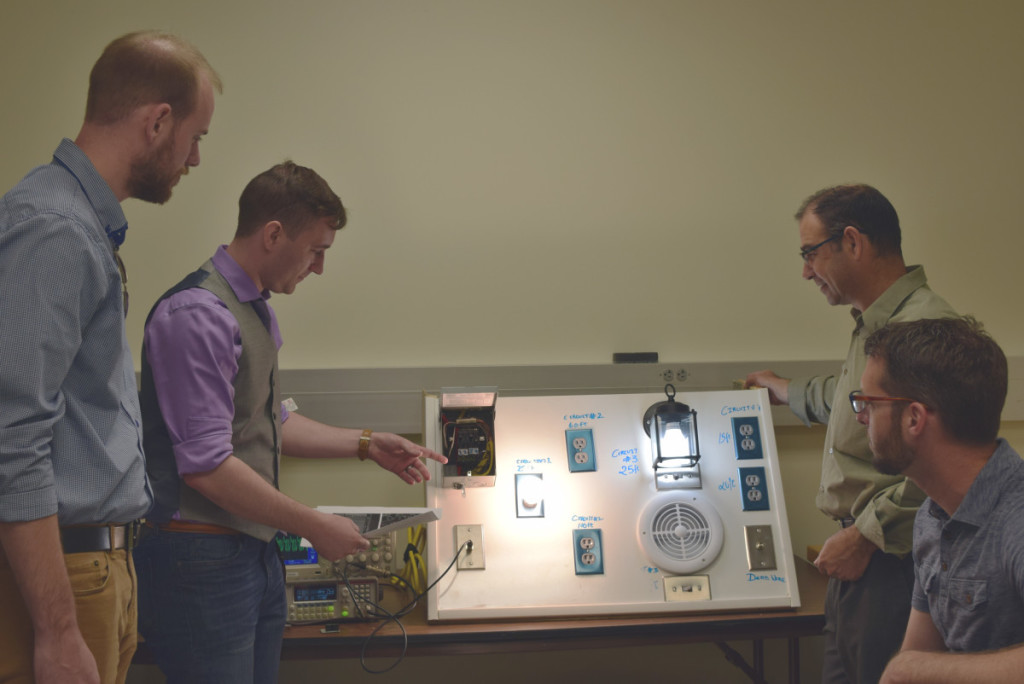
Additionally, I will be posting more images about our brainstorming session as well as traveling to UNO Peter Kiewitt Institute to meet with Dr. Moe Alahmad and his technology for deciphering signals to individual outlets throughout a building.  Pictured from left to right are Michael, Ryan, Moe and Professor Tim Hemseth.

Good Image        The Machine

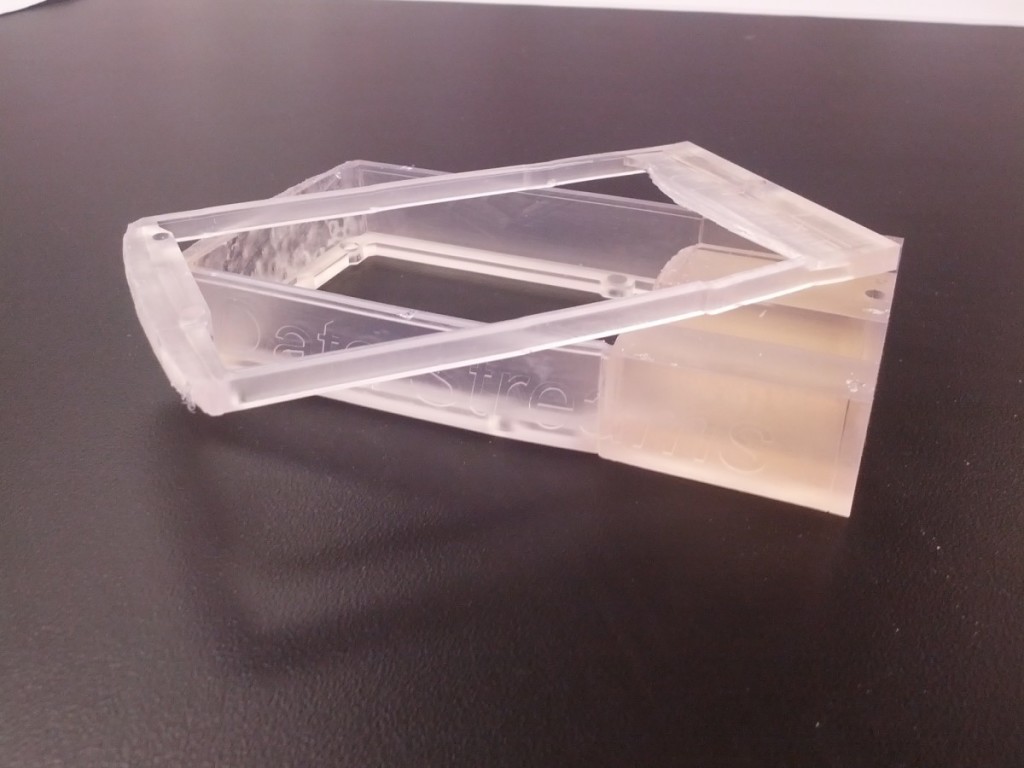
3D print of Mote

IMG_20150401_155716

We now have a working prototype for the Mote Module from Michael’s previous post last month.

This really begins to show DLR Group’s reach into the technology that will drive the future.  Our ability to quickly create data, software and prototypes will be a key factor in our progress as a company for the next decade and beyond.

Social Media

Stay up-to-date with our latest findings and progress