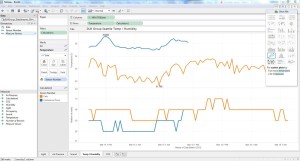
Data Streams + Tableau

We’ve begun preliminary scrubbing of the data and have created a rough skeleton in Tableau for our cloud sourced environmental data to feed into. Ryan will be culling his energy data as well and we will be able to integrate it into our dashboard to display multiple variables at once. The goal is to have […]

Data Collection

With our software now in place, we are collecting information on several sets of workstation energy-related data.  To reiterate, after careful examination, Michael and I determined that collecting it every second or even every minute might be a bit excessive and not provide any relevant information that every 15 to 30 minutes couldn’t.  Although our […]

Even Edison had setbacks

So for full disclosure we did say we’d post our triumphs and failures.  Today I discovered a failure.  The energy monitoring devices have a touch sensitive on/off switch.  (Don’t ask me why an outlet needs a touchscreen?!?) but if you have something dangling from your monitor that can carry static electricity.  That can be enough […]

Live Motes!

Sensor Motes are up and running in two locations at the Seattle Office – Cafe and Large Conference room. Two more sensor motes are in production to measure open office environments as well. We will continue to monitor and troubleshoot the motes over the next several weeks until the bugs are ironed out.

Data bias

Researchers use plenty of statistical methods and mathematics, in isolation or combination, to turn data into a prediction.  What starts as collection, quickly turns to analysis.  The inevitable “what can we do with it?” and “why are we doing it?” Ironically a little data coding can answer these questions. <formula> <Dataset1 = N+1) Ask Do […]